
Dashboard Theory
Data alone doesn’t improve performance. Insight comes from interpretation, and impact comes from communication.
Foundations
The foundation for this app was an iBook created as part of the UCSIA15 open online course with the late Prof. Keith Lyons.
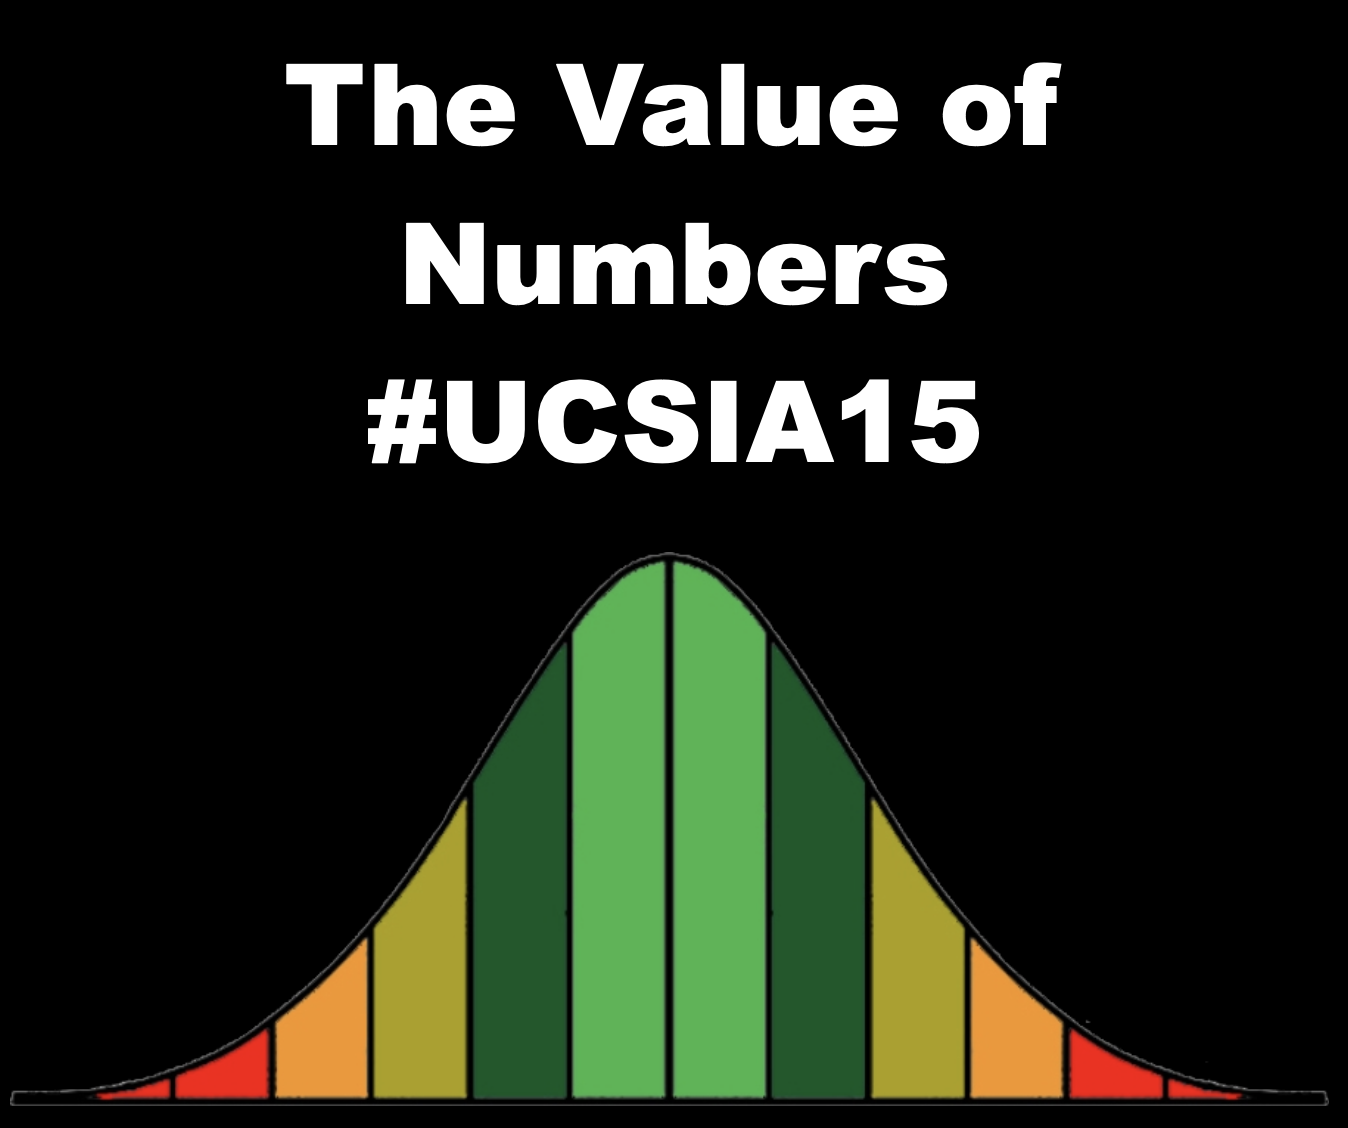
Keith’s UCSIA15 materials are referenced here: keithlyons.me/tag/ucsia15/.
This work helped shape the core idea: numbers become valuable when they are contextualised, distilled, and clearly communicated.
You can access the iBook directly here: TVON_UCSIA15.ibooks.
(View on Apple Books (macOS/iOS). If your browser downloads the file, open it from Downloads.)
Some of the hyperlinks are now dormant
From numbers to understanding
We live in a world awash with data. But data alone does not improve performance. Numbers only become valuable when they are contextualised, distilled, and clearly communicated.
Insight comes from sense-making — not from dashboards that simply list totals.
Impact comes when coaches and players can see the meaning and talk about it.
This is analysis in service of learning, coaching, and action — not analytics for its own sake.
HighLightIt! Dashboard helps analysts, coaches, and educators:
- Identify what actually matters
- Distil complex information into clear signals
- Visualise performance in ways that support understanding (not overwhelm it)
- Tell the story behind the numbers
Built on questions, not charts
Effective analysis does not start with software. It starts with good questions. The Dashboard supports a natural workflow:
- Ask meaningful performance-related questions
- Select valid, relevant indicators
- Compare performance against context (not just raw totals)
- Present results in a form that is easy to interpret and discuss
The Dashboard does not dictate answers — it supports sense-making. It is designed to be explainable, teachable, and conversation-ready.
When information is clear, conversations improve.
Simplicity over spectacle
Data visualisation should clarify, not impress. The goal is not novelty. The goal is clarity.
Interpretability beats novelty — especially under real coaching tempo.
Consistent scales and colour logic reduce cognitive load.
Normal performance fades into the background so the noteworthy stands out.
“In sum, finance functions know that they will need to do more than simply churn out numbers if they are to help business managers avoid information disasters. More and more, business managers will expect finance staff to tell the story behind the numbers.”
Sport is no different.
Performance indicators with context
Performance indicators are only useful when they are carefully selected, interpreted within context, and understood by the people who use them.
- Multiple indicators on a single, comparable scale
- Visual emphasis on strengths and weaknesses
- De-emphasis of “normal” performance to reveal what matters most
- Comparison across matches, sessions, or phases
Raw numbers are rarely comparable. The Dashboard applies simple, proven statistical thinking — not to complicate analysis, but to normalise it.
By mapping indicators relative to historical performance, different metrics can be viewed together and direction + magnitude become immediately visible.
Not a verdict. A prompt. The tool flags where to look and talk — coach insight and context remain central.
Longitudinal insight without data overload
Tracking performance over time is essential — but more history is not always better. The Dashboard supports sensible longitudinal views with awareness of trends without false certainty.
See drift and improvement without over-reading single games.
Personnel, strategy, and environment shift — interpretation must shift too.
It encourages analysts to think about the data — not simply trust it.
Evergreen by design
The principles here are not tied to a sport, level, or era. They are grounded in performance analysis practice, coaching communication, learning science, and visual clarity.
- Elite and grassroots sport
- Education and applied research
- Teaching, coaching, and analyst development
What is a Z-score (and why you don’t need to fear it)
You don’t need to be a statistician to understand a Z-score. At its heart, it answers one practical coaching question:
“Was this performance normal, better than normal, or worse than normal?”
A Z-score compares a single performance to what usually happens. Instead of raw totals, it shows:
- Direction — above or below typical?
- Magnitude — how far from typical?
You don’t need to calculate this — the Dashboard does it for you.
- Typical performance = average of previous games/sessions
- Normal variation = how much performance usually goes up/down
- 0 = typical / normal
- Positive = better than normal
- Negative = worse than normal
- Different indicators can be viewed together
- Strengths/weaknesses stand out quickly
- Normal fades; signal remains
A Z-score does not say why something happened. It flags where to look and talk.
If analytics is the discovery and communication of meaningful patterns in data, the essence lies with information distillation, visualisation and coherent storytelling. Simple maths. Powerful clarity. That’s why Z-scores matter here: they remove noise, support interpretation, and help tell the story behind the numbers.